28.2 million kilometres — 17.5 million miles of footpath, bridleway and mountain track, in every country on Earth. Plus the trail data the agencies who maintain the tracks actually publish, contour lines generated for anywhere on the planet, walking times that account for the climb — and all of it still works with your phone in airplane mode.
Free for a week, no card. No ads, no tracking, ever.
Why this exists
General-purpose maps are built for driving. Go on foot and the things that decide your day simply are not there: how steep the next kilometre is, whether there's a hut at the far end, whether the track is even open. Then you lose signal and the map goes blank — usually about an hour after the point where it started to matter.
A trail drawn on a flat grey background tells you nothing about the 1,200 m of climb hiding in it. Terrain is the information.
Park services publish grades, walking times, huts and closures. Community maps rarely carry them, so you find out at the trailhead.
A map that needs a connection is a map that fails exactly where you needed it. Download a region before you go and it stays on the device — 42 regions across six continents, each with its satellite imagery and its 3D terrain, plus New Zealand in full.
What makes it different
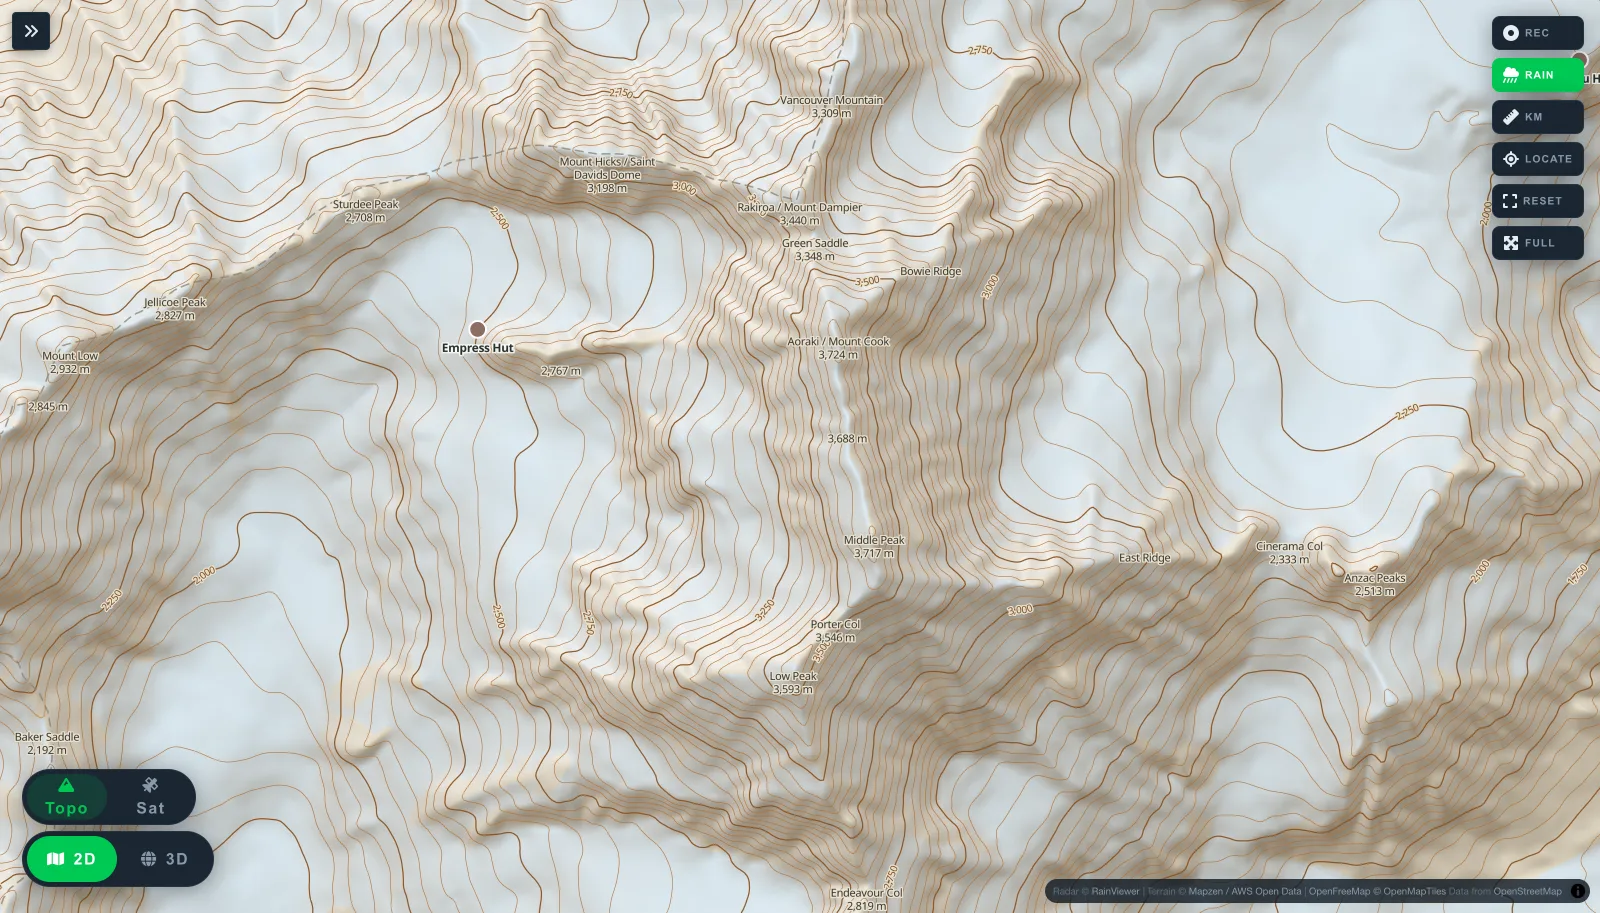
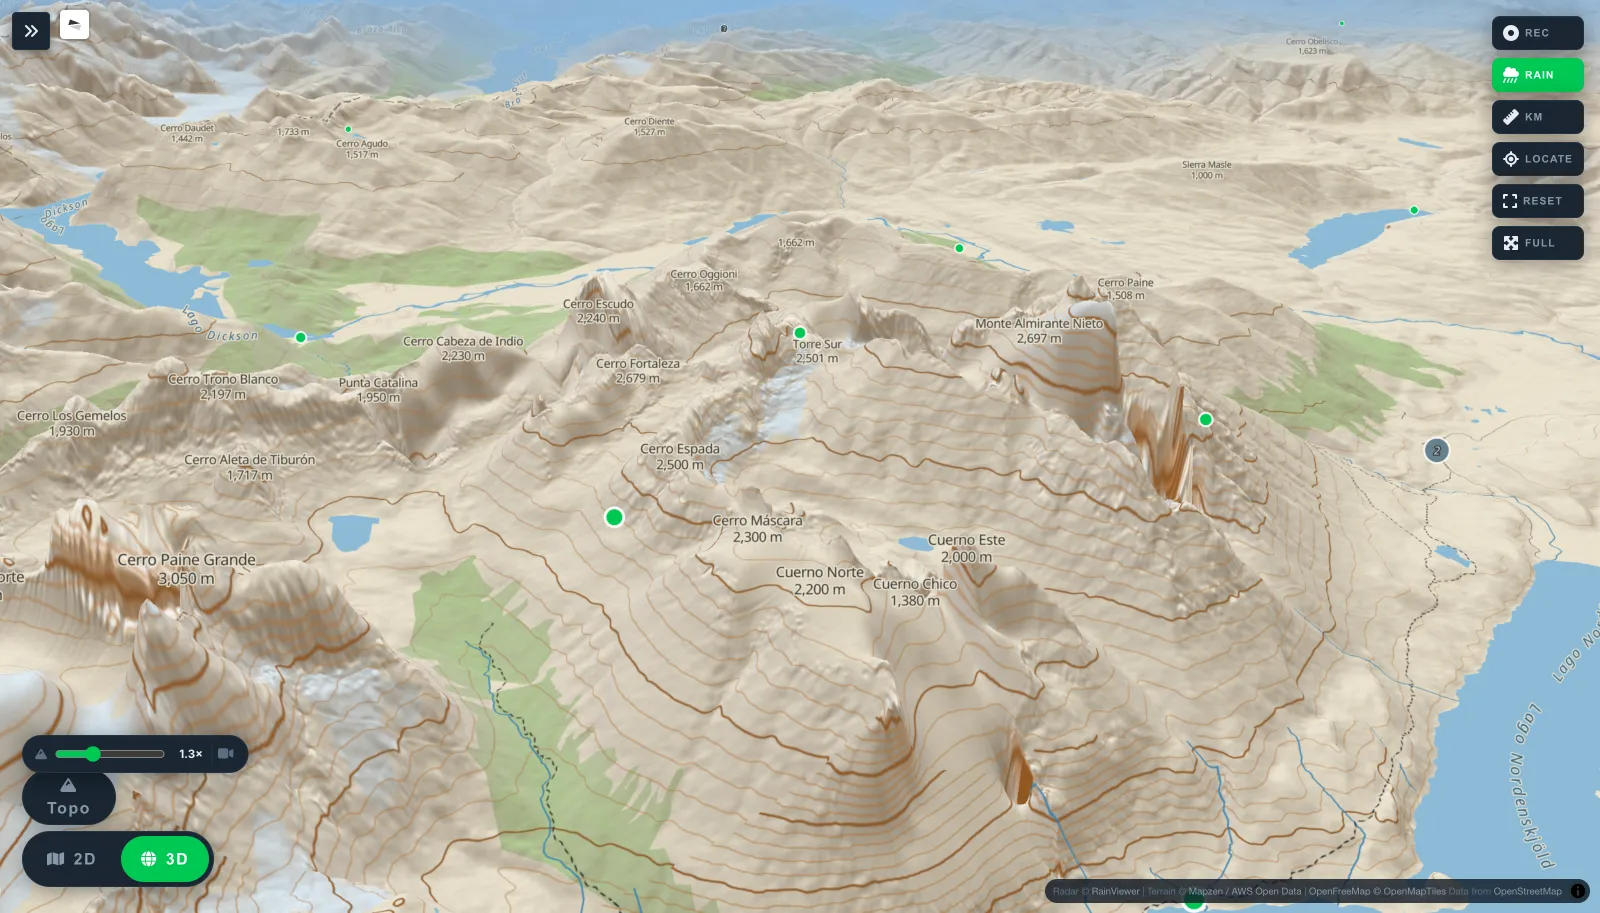
Contour lines are usually a national mapping-agency product, which is why most apps have them for one country and nowhere else. Ridgeflow generates them in your browser from global elevation data — so the cartography over Patagonia is the same cartography as over the Southern Alps.
Index and intermediate contours with elevation labels, water, landcover, hillshade, place and peak names — drawn as a coherent sheet rather than a street map with trails on top. Intervals follow whichever units you pick.
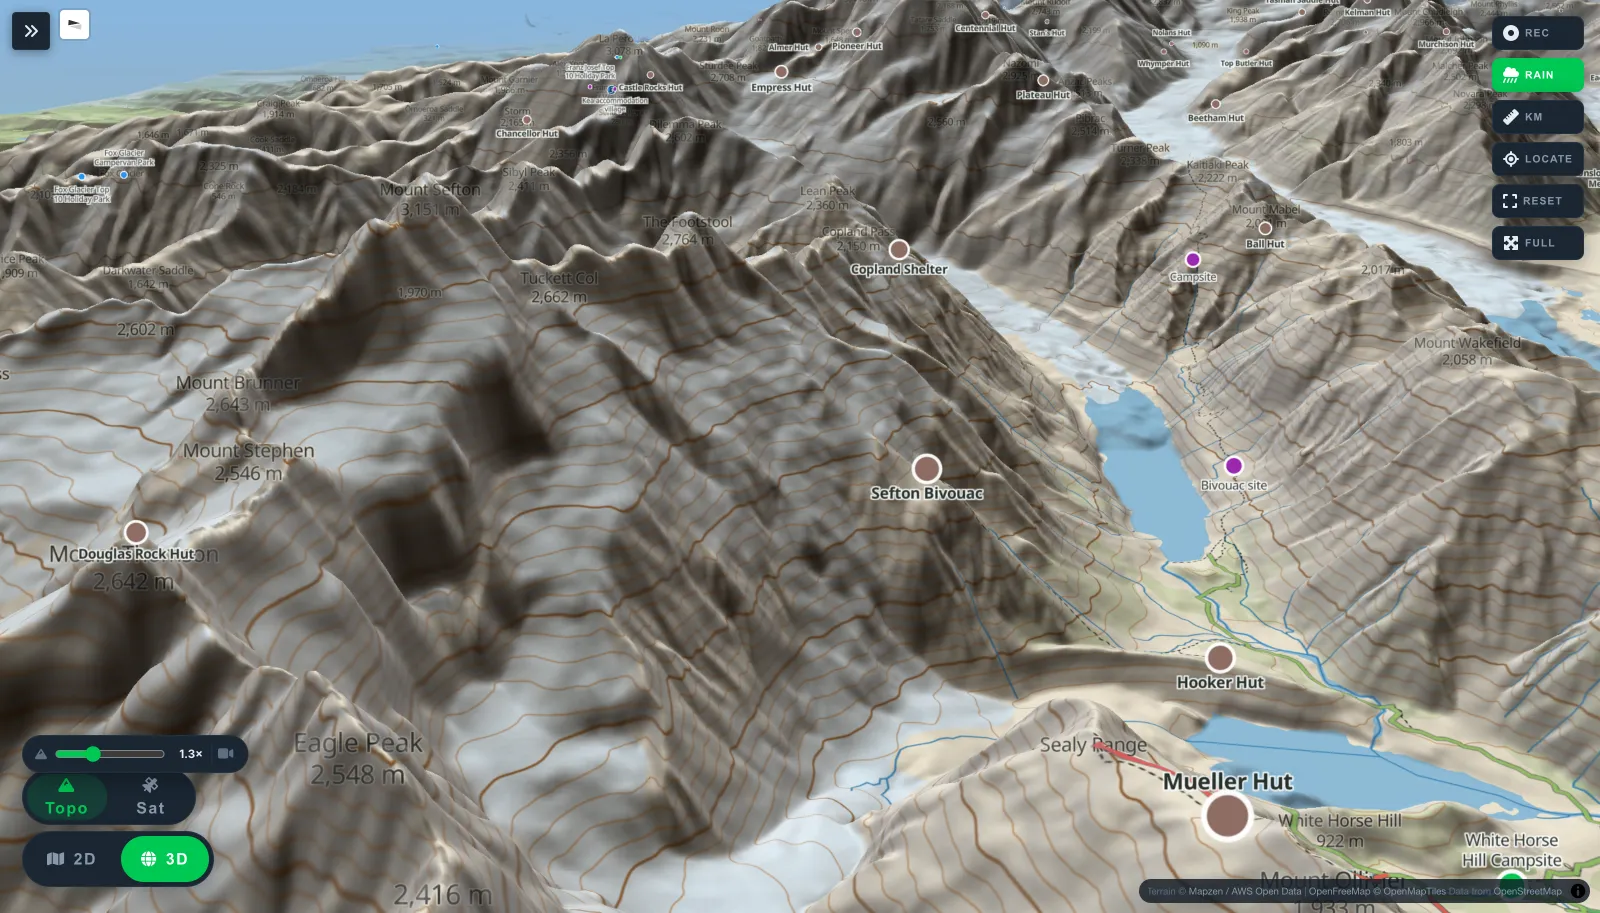
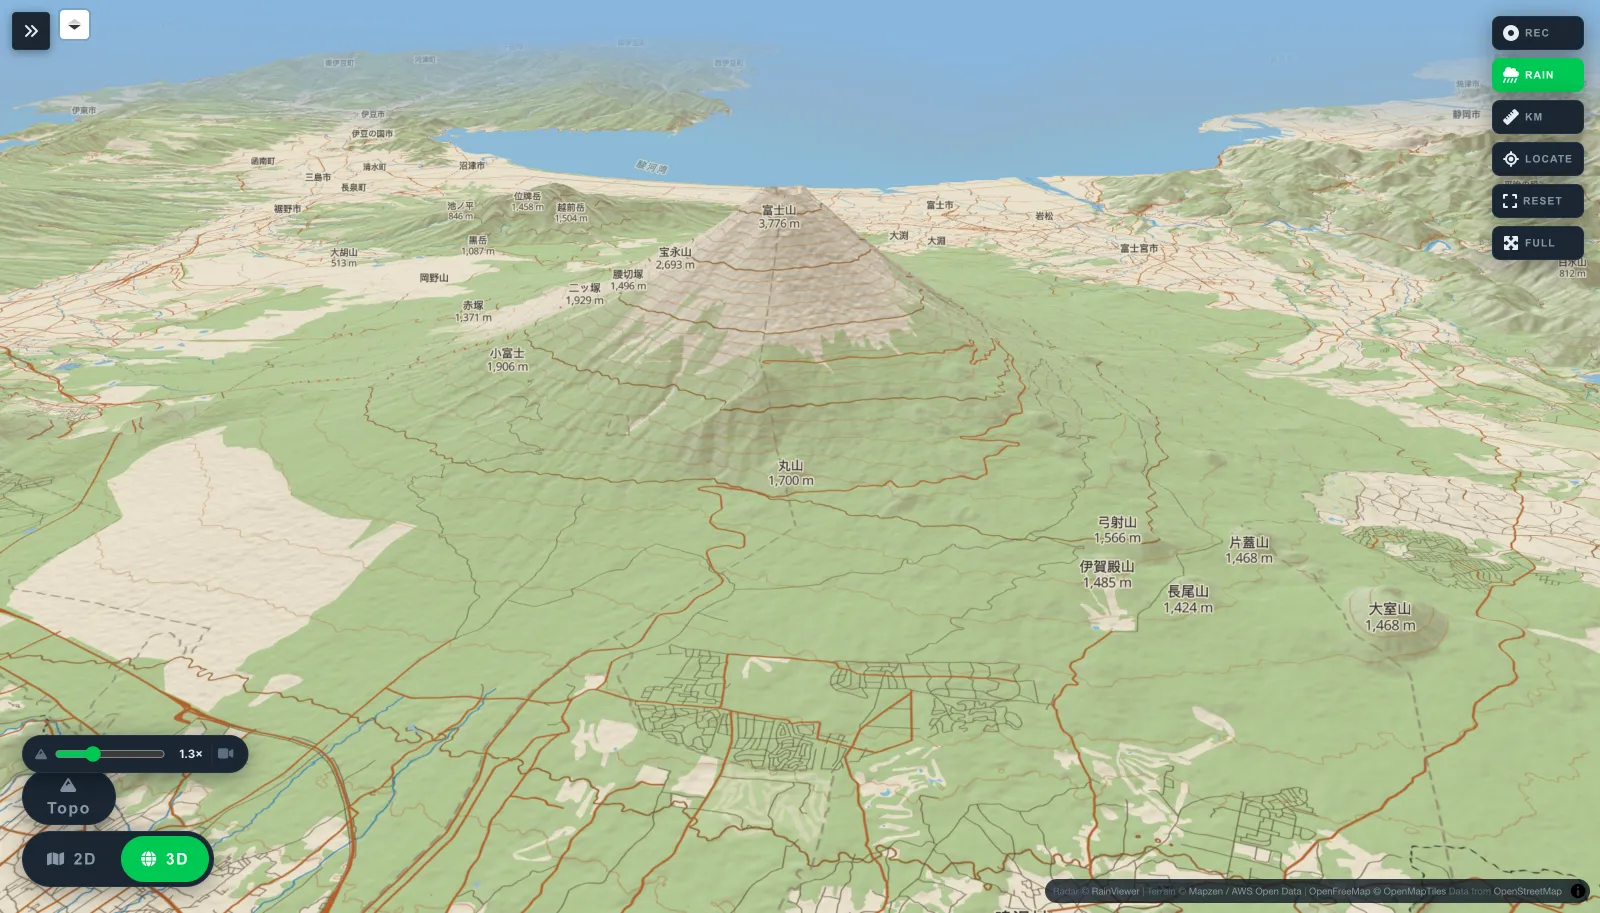
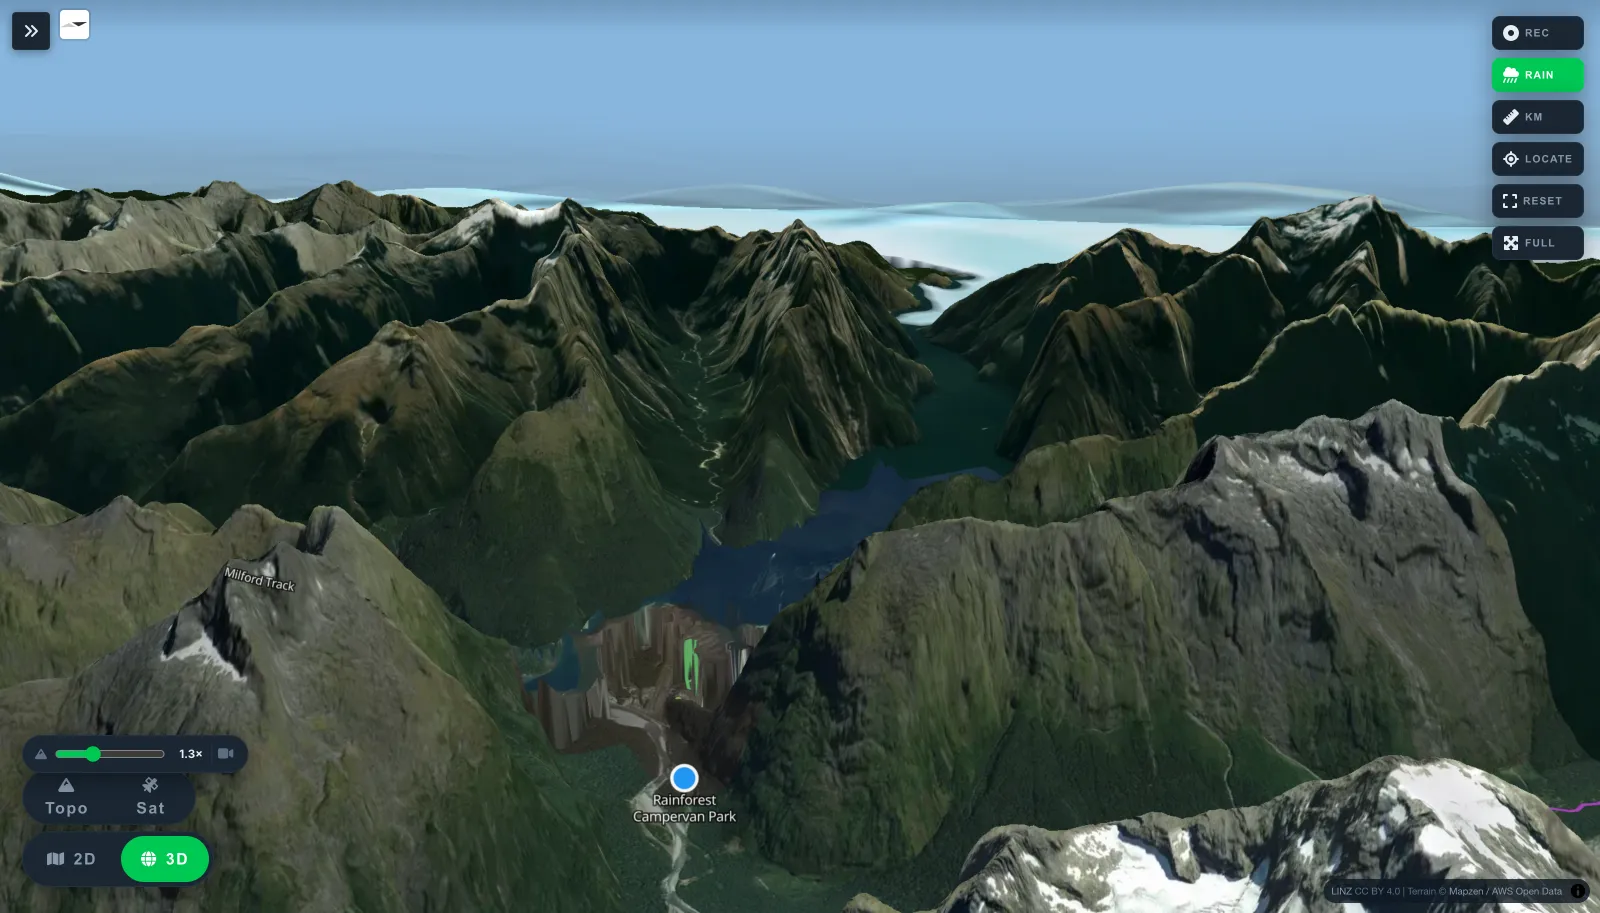
Tilt into 3D and the route stops being a line and becomes a shape: which side of the ridge, how the spur runs, where the pass actually is. Real elevation data, exaggeration you control, and a camera that will not drop below the ground.
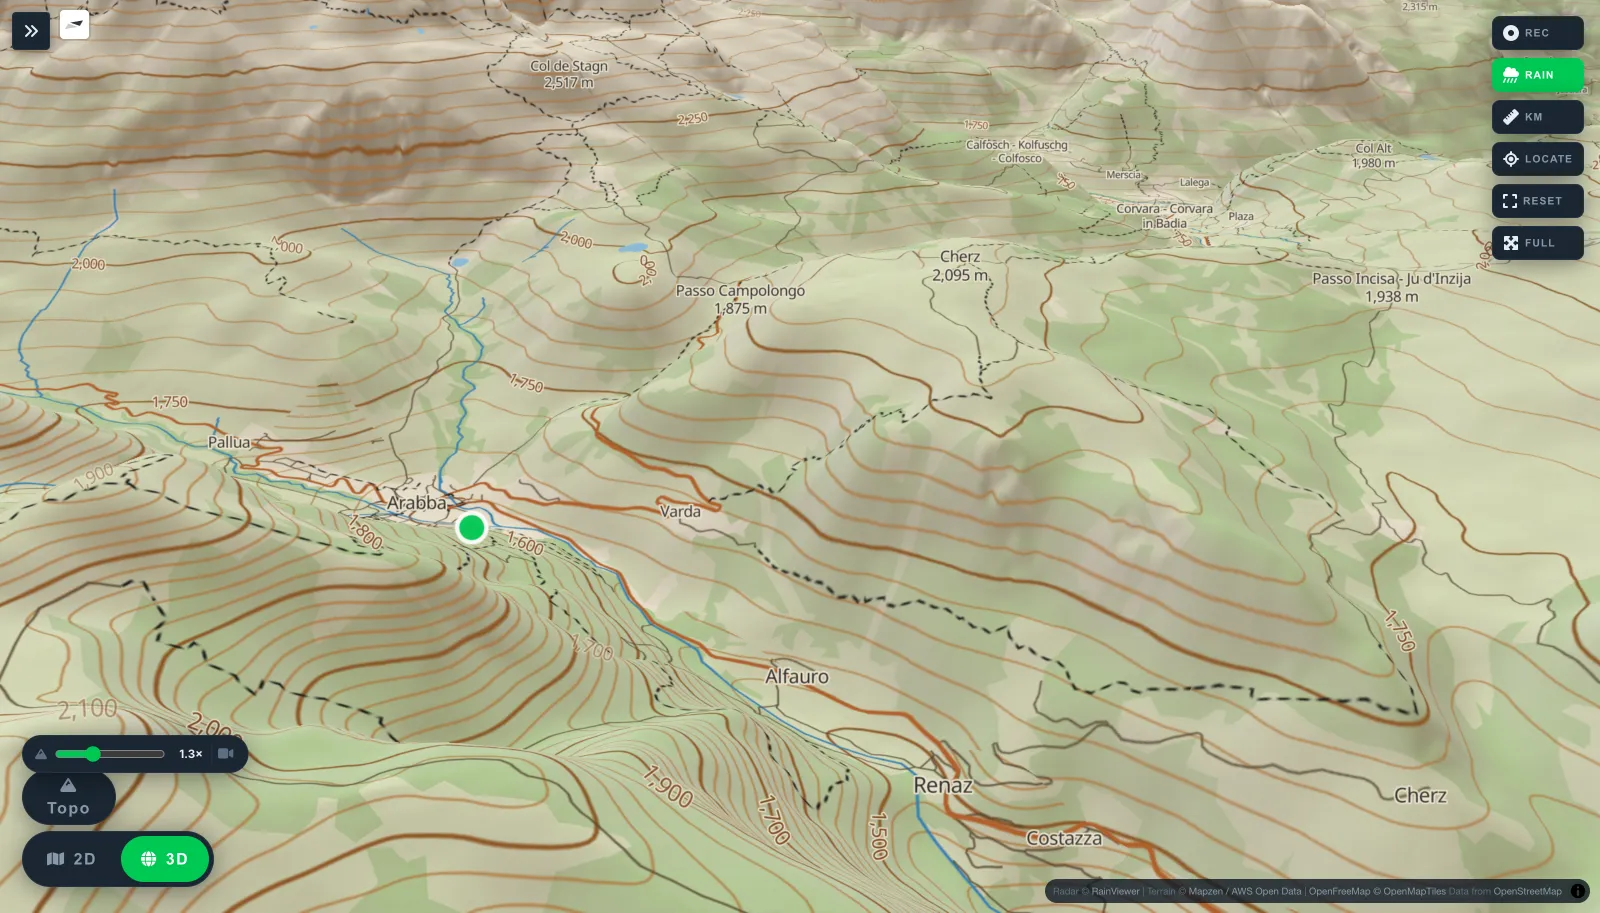
Three layers, kept honestly apart. Government and park-agency networks carry the publisher's own grade and walking time. Named community routes from OpenStreetMap fill in what the agencies never digitised. Underneath both sits the walking network itself — every footpath a mapper has ever traced, most of which belongs to no named route at all — drawn quieter, because that is what it is. Nothing is given a grade it does not have.
Routing on a foot profile, with time estimates from the gradient rather than a flat average speed — so a 12 km day with a saddle in it is not costed like 12 km of valley floor. Then it tells you where you can sleep.
The part we care most about
Coverage is uneven, and pretending otherwise is how people get hurt. Where an authority publishes closures, avalanche advisories or severe-weather warnings, Ridgeflow shows them. Where it has none, it says so in plain words instead of showing a calm empty map that reads like an all-clear.
"No warnings here" and "we don't carry warnings here" are different sentences, and you get whichever one is true.
Closure information carries the date it was retrieved and the agency it came from, because a month-old notice is not today's conditions.
If there's no elevation data for a track it says so rather than printing a confident "+0 m" that reads as flat ground.
Anywhere means anywhere
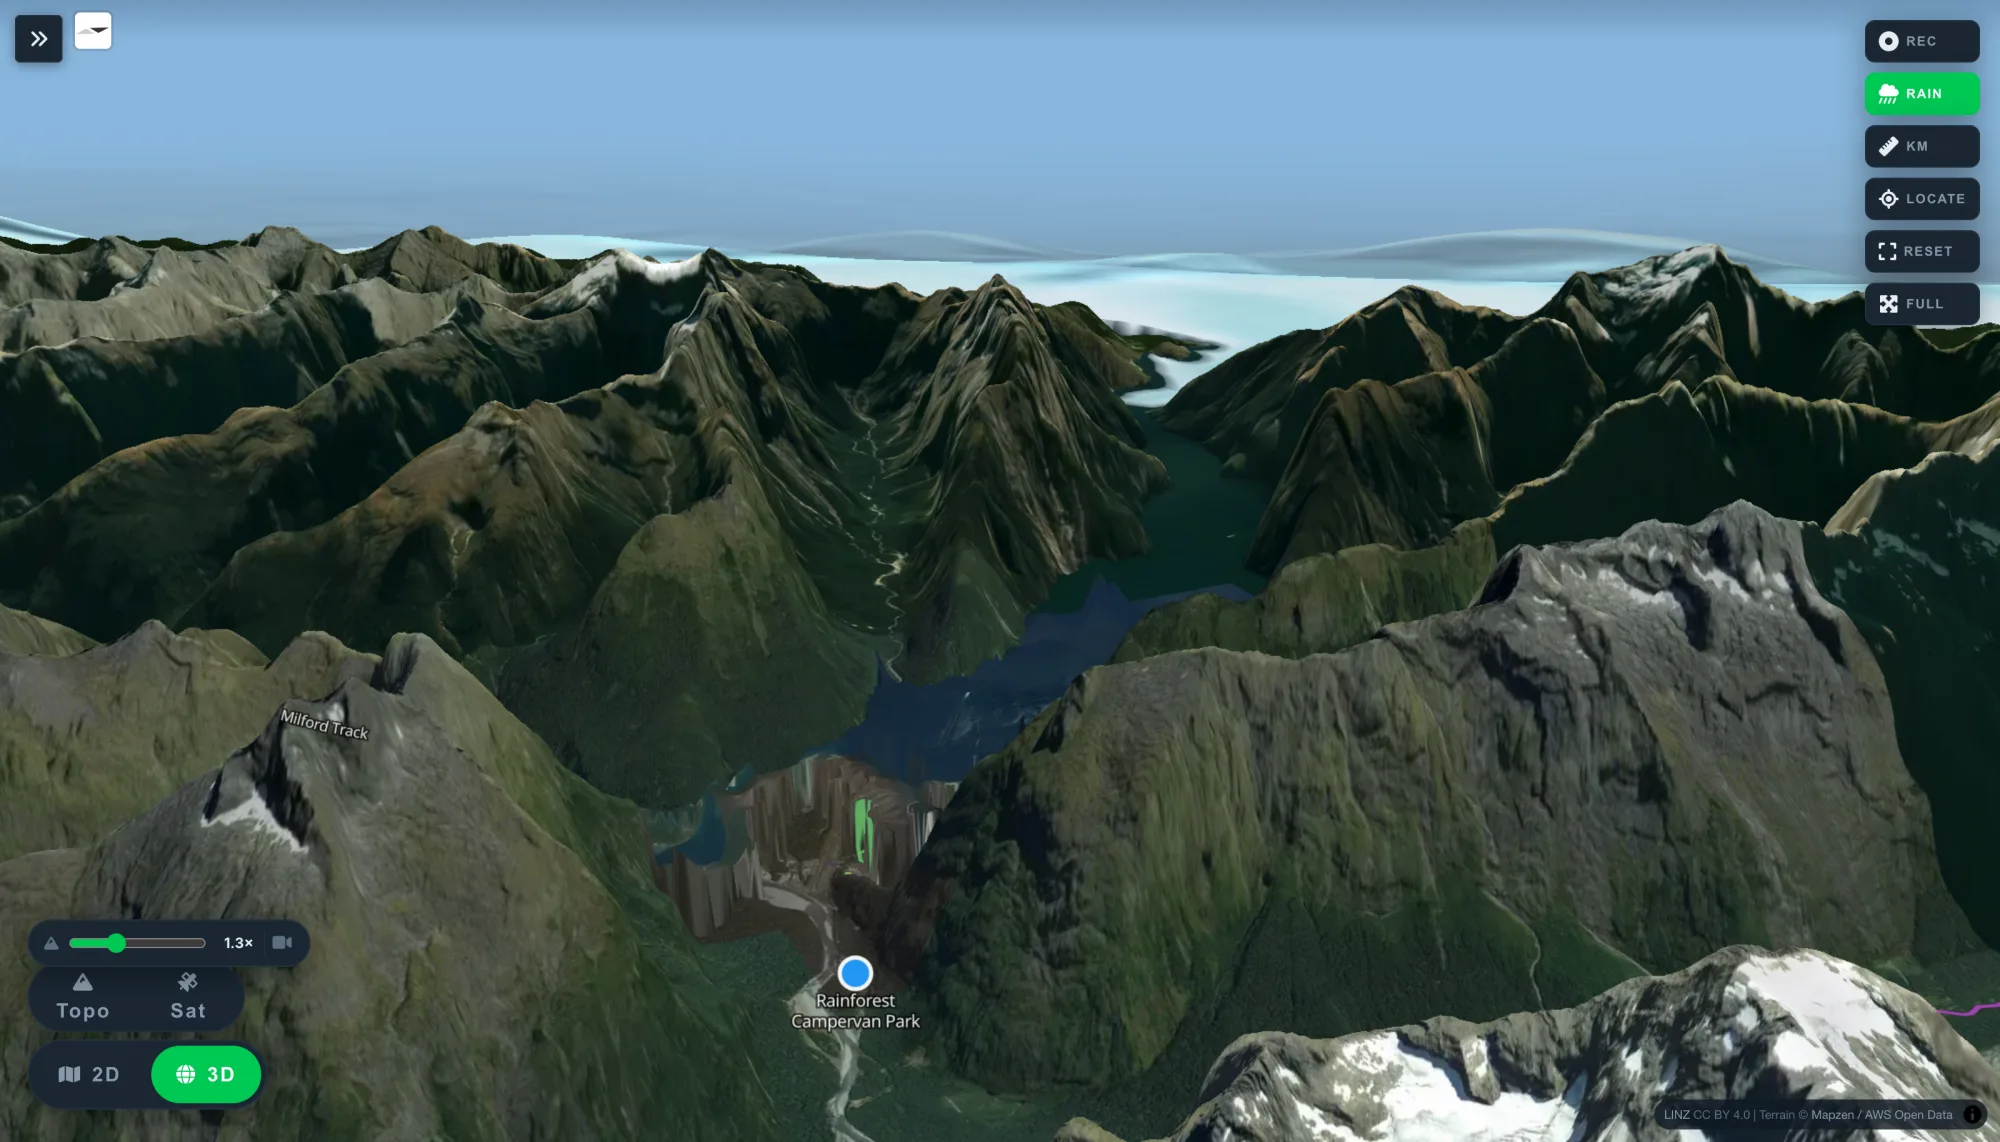
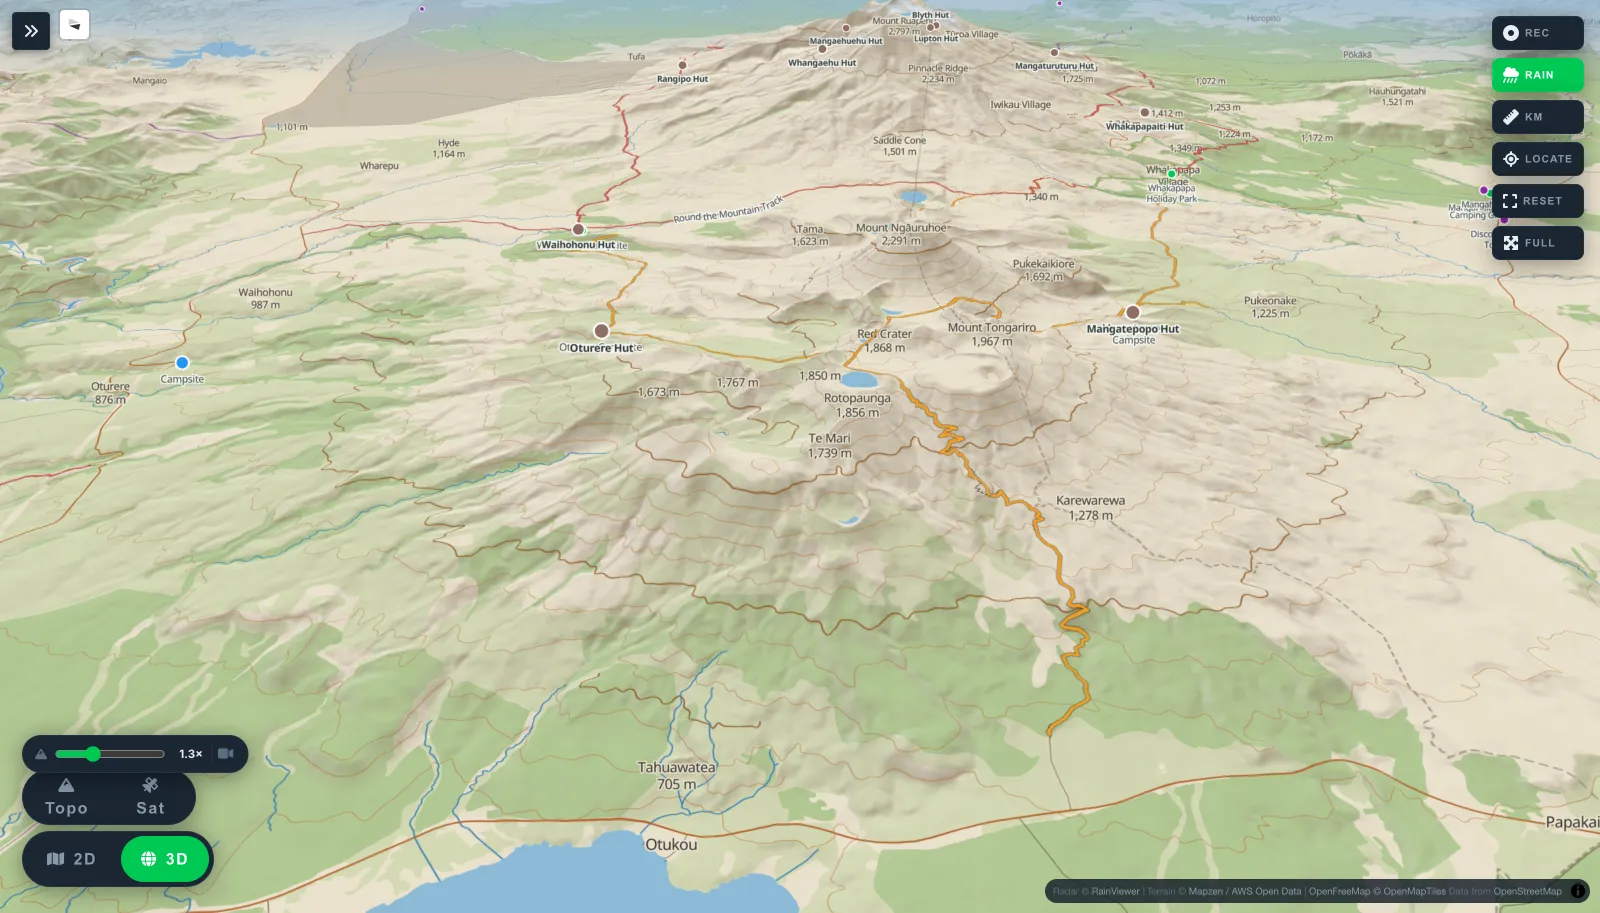
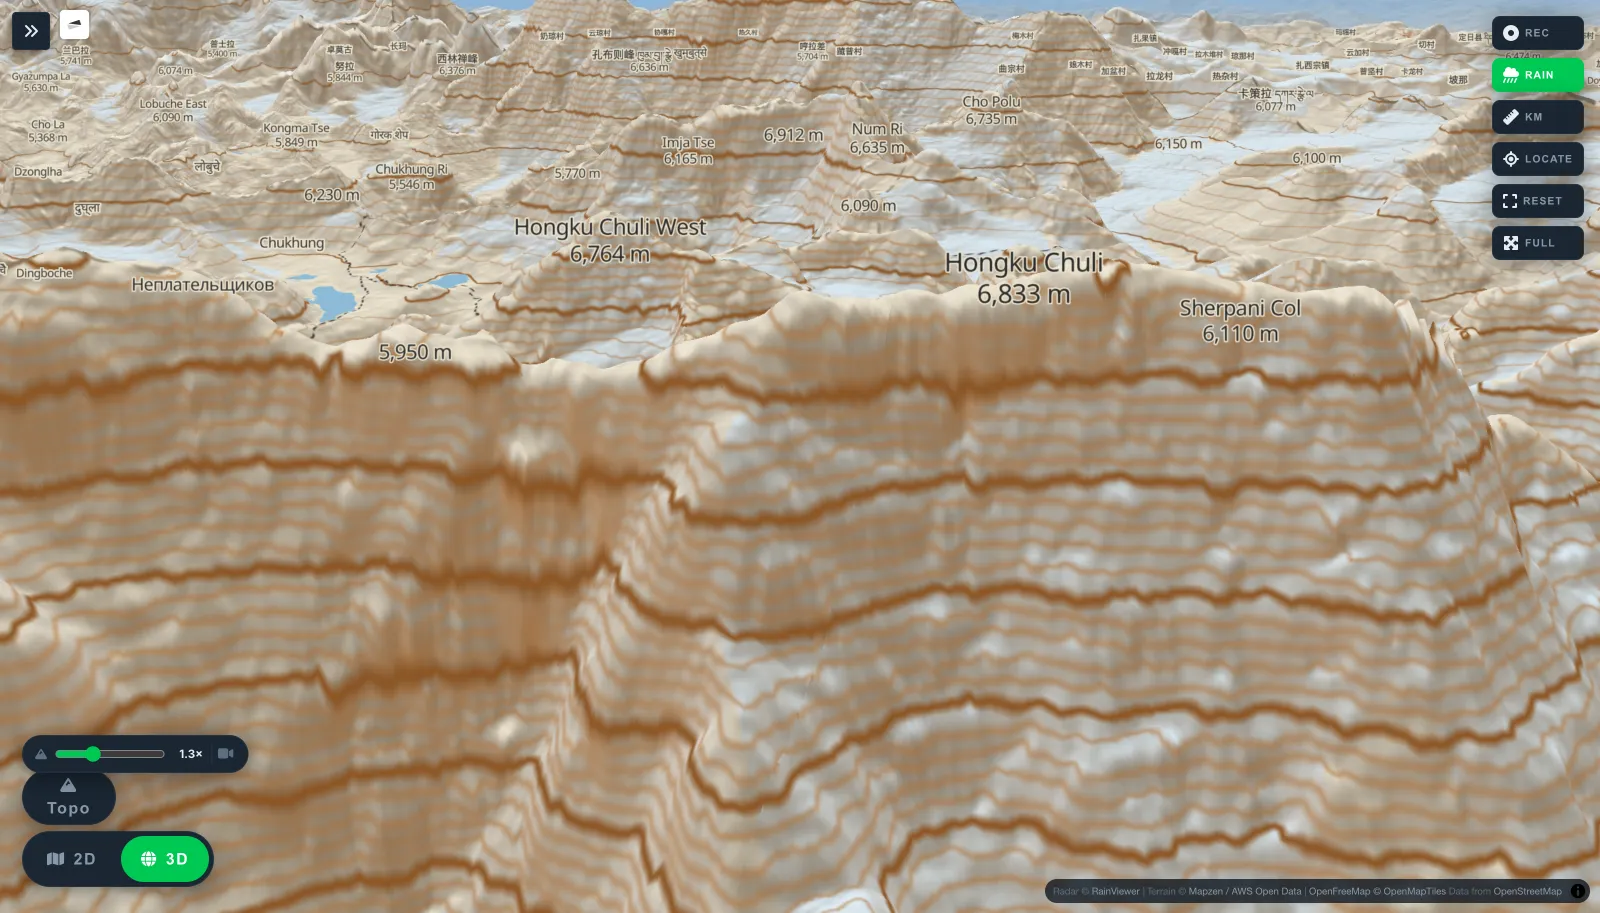
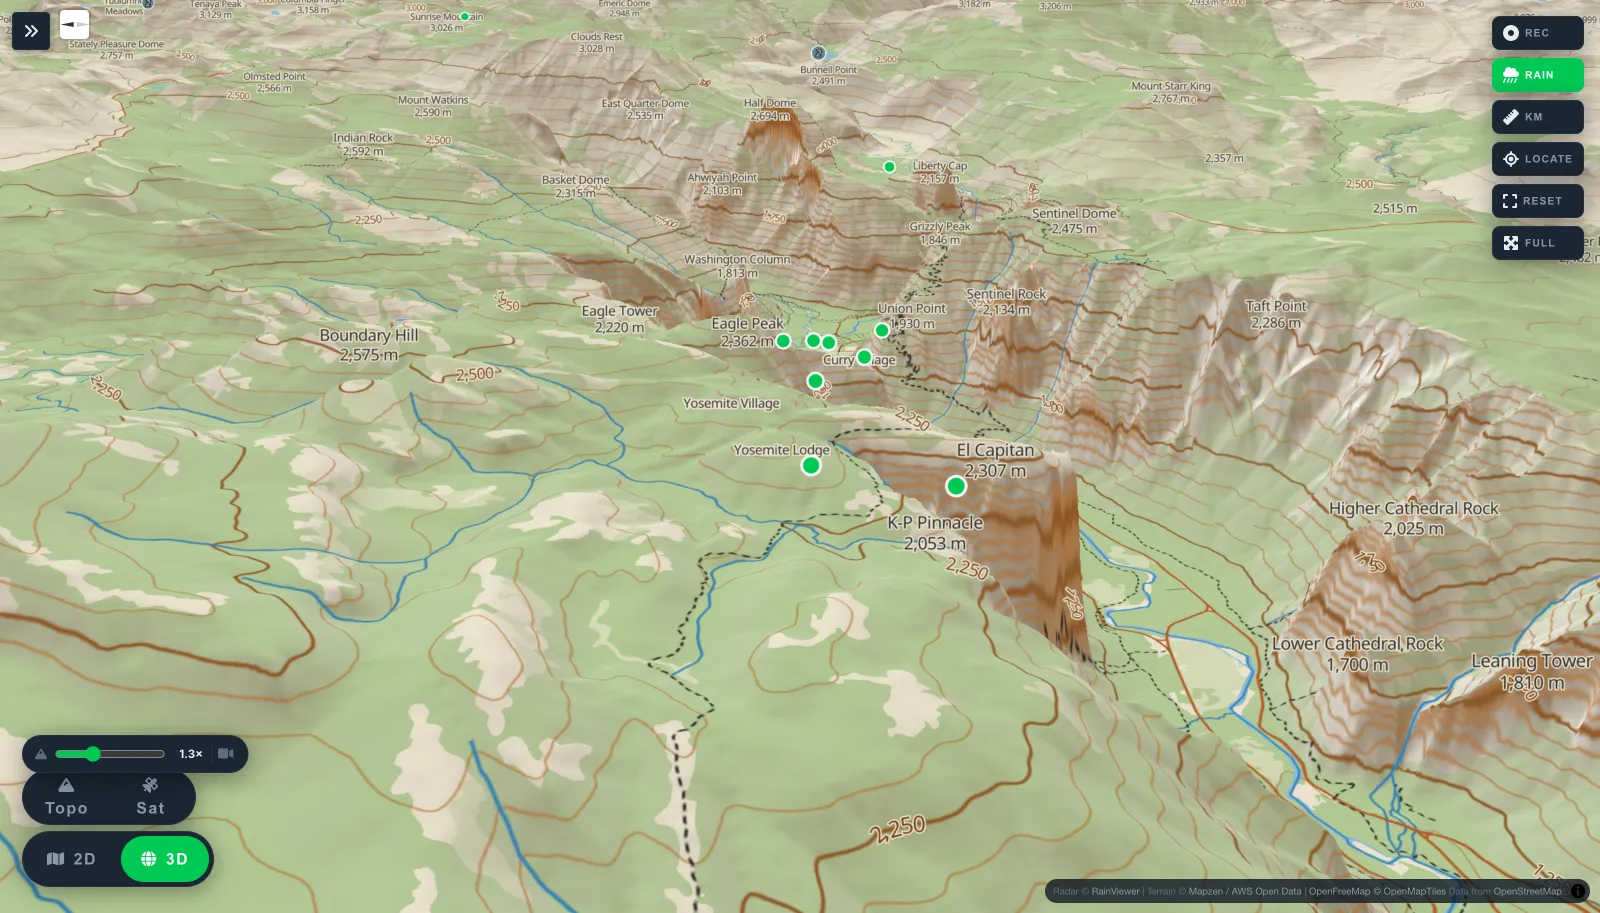
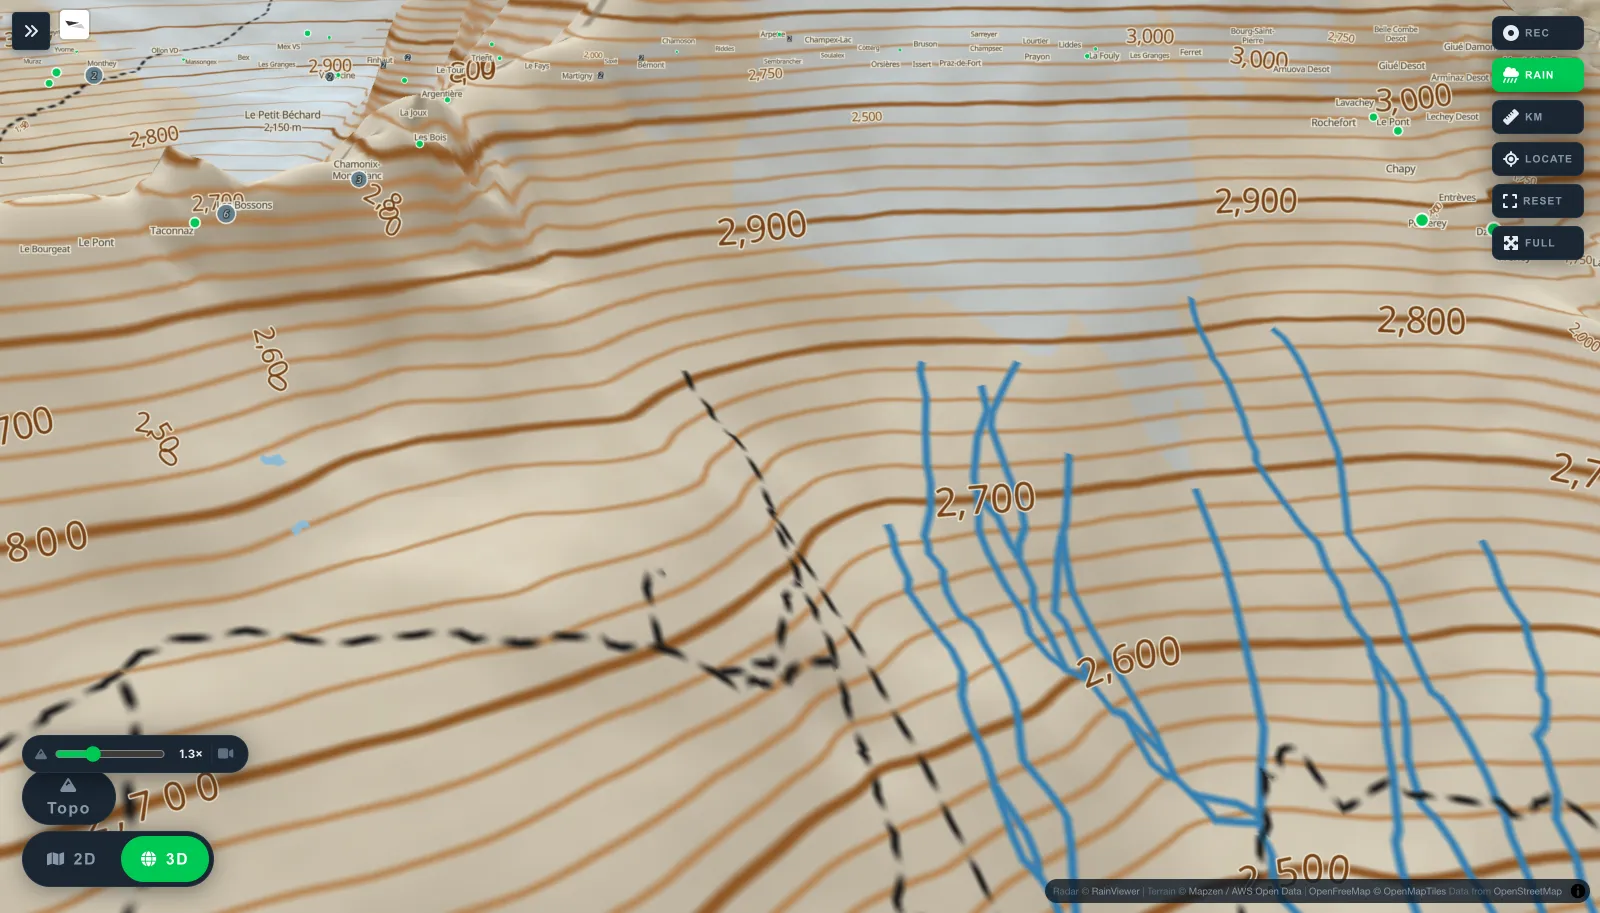
Every one of these is a screenshot, not an illustration.
Reference
Off the grid
Download a region and the map, the satellite imagery and the 3D terrain come with you. The trail data is already on the device. Recording keeps running with the screen off and the phone in a pocket — which is where a phone spends most of a walk.
What it costs
Free for a week.Everything unlocked, no card. After that the map stays free.
Make an account with your email address or with Google, and for seven days every feature is open. No card is asked for, and nothing renews by itself — if you do nothing at the end of the week, nothing is charged.
When the week ends the map does not lock. The topo sheet, 3D terrain, the trail data, huts, campsites, search and forecasts all stay free, for good. Four things need a subscription: route planning, offline map downloads, weather overlays and trip recording. Offline downloads are the honest reason there is a price at all — serving gigabytes of terrain costs real money every month.
An earlier version of this page said planning was intended to stay free. That changed when accounts went live, and this is the announcement it promised. Nothing you have already saved is taken away.
Questions
Yes — with your email address or with your Google account. It takes a moment and no card is asked for. Everything is open for seven days; after that the map, the trail data, huts, campsites and forecasts stay free, and route planning, offline downloads, weather overlays and trip recording need a subscription. A route someone shares with you still opens without any account at all.
The contour topo map, 3D terrain and community trail data are worldwide. Official agency data exists for a growing list — the United States, Switzerland, France, Norway, Ireland, Czechia, Slovakia, Luxembourg, Slovenia, Germany (Bavaria), Italy (South Tyrol), Austria (Tyrol), Canada, Australia, Hong Kong, Singapore, Taiwan and New Zealand, which has the deepest coverage. Where an area has thin data, the app says so in the Layers panel rather than leaving you to guess.
It runs in the browser on a phone or a laptop, and installs to your home screen like an app — including working with no connection. An Android build is in progress.
They are estimates from distance and gradient, tuned differently for hiking and running. Where an agency publishes its own time for a track, that figure is shown too — and if ours disagrees with theirs by much, you are told both rather than just ours.
Treat it as a prompt to check, not a clearance. It is only as fresh as the agency's own feed, it carries the date it was retrieved, and for most of the world no such feed exists at all — which the app states plainly. Always verify locally before you go.
No, and it isn't meant to. It is a planning and navigation aid running on a device with a battery. Carry a paper map, tell someone your intentions, and use your own judgement about conditions.
OpenStreetMap contributors, national mapping agencies and park services, each under its own licence — credited in full at the bottom of this page and inside the app.
It opens on a map of the world. Find somewhere you're thinking about walking.
Free for a week · The map stays free · Offline by region
 Ridgeflow